
I’ve come from a background of Qlikview development and I’m now learning Power BI. With all the information around Covid-19 being released I wanted to do some analysis myself. The Office of National Statistics (ONS) produce lots of extracts and it’s perfectly possible to download excel files off their website. However, that’s not as much fun or a challenge as automating the process. This blog post walks you through the process of building the Power BI ONS custom data connector.
With Power BI it’s possible to build custom data connectors with the SDK.
With the help of various other blog posts (kasperonbi) and the Microsoft examples (TripPin), I’ve been able to get it working. It has also been a good learning exercise in the functional language M.
The Office of National Statistics have a Beta API (https://developer.beta.ons.gov.uk/) which is open and unrestricted (no oAuth2 etc). As it’s in Beta it should not be relied upon and as their site says may ‘occasionally be breaking’.
Before you get too excited, I should warn you the data available here appears to be quite limited, only data from the current year is present. However, you can find previous years’ data in excel files on their site.
If you just want to use it and are not interested in the detail, follow these steps:

 Each dataset has several dimensions and allowed options, think of them as filters and filter values (i.e. time = 2020 and sex = male).
For each request all dimensions must be used with valid options. There is a wildcard option however this is only allowed to be used on one dimension per request.
This means you cannot send one request to get all the data from a dataset. However, you can send many requests to get around this and we’ll get to that in a bit.
My connector uses the weekly-deaths-age-sex dataset.
To get a list of all required dimensions run this command in postman:
https://api.beta.ons.gov.uk/v1/datasets/weekly-deaths-age-sex/editions/covid-19/versions/4/dimensions
For each dimension run this command to get a list of valid options:
https://api.beta.ons.gov.uk/v1/datasets/weekly-deaths-age-sex/editions/covid-19/versions/4/dimensions/agegroups/options
I’m using the following options:
Each dataset has several dimensions and allowed options, think of them as filters and filter values (i.e. time = 2020 and sex = male).
For each request all dimensions must be used with valid options. There is a wildcard option however this is only allowed to be used on one dimension per request.
This means you cannot send one request to get all the data from a dataset. However, you can send many requests to get around this and we’ll get to that in a bit.
My connector uses the weekly-deaths-age-sex dataset.
To get a list of all required dimensions run this command in postman:
https://api.beta.ons.gov.uk/v1/datasets/weekly-deaths-age-sex/editions/covid-19/versions/4/dimensions
For each dimension run this command to get a list of valid options:
https://api.beta.ons.gov.uk/v1/datasets/weekly-deaths-age-sex/editions/covid-19/versions/4/dimensions/agegroups/options
I’m using the following options:
 Extract the content then double click the solution file (ONS.sln) to load visual studio.
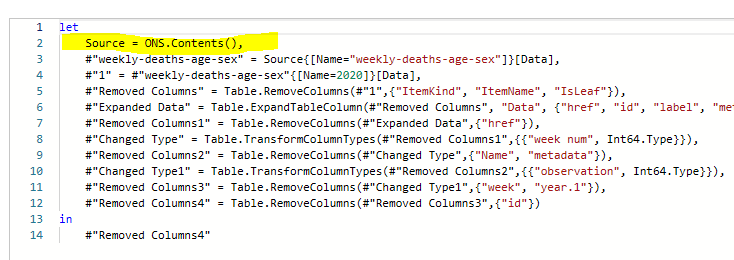
Open ONS.pq and note the ONS.Contents() function. This is what will be called by PowerBI
Extract the content then double click the solution file (ONS.sln) to load visual studio.
Open ONS.pq and note the ONS.Contents() function. This is what will be called by PowerBI

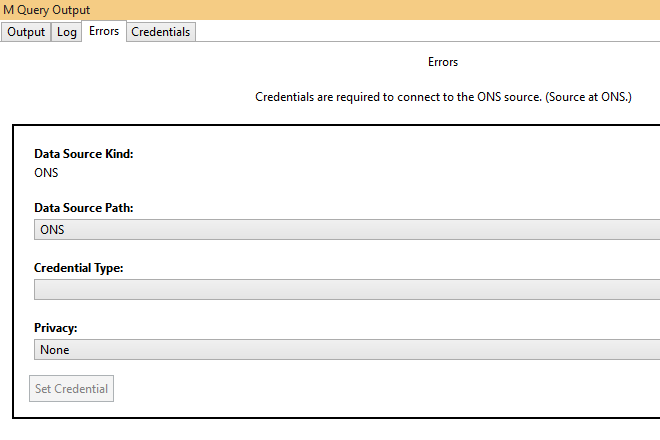
 When you run the program you’ll get this screen, set the Credential Type to anonymous and click ‘Set Credential’ and close the message box. Now rerun the program and it should display the query result where name is weekly-deaths-age-sex
 At this point the connector has been built, you’ll get a complied .mez file in your debug folder.
ONSbinDebugONS.mez you can copy the steps above from 2 to get this working in Power BI Destop.
You’ll be able to create some visultions. Here is one I built (this also uses histroic data available in spreadsheets). It updates weekly on my website: https://www.blueoceanweb.co.uk/portfolio/
At this point the connector has been built, you’ll get a complied .mez file in your debug folder.
ONSbinDebugONS.mez you can copy the steps above from 2 to get this working in Power BI Destop.
You’ll be able to create some visultions. Here is one I built (this also uses histroic data available in spreadsheets). It updates weekly on my website: https://www.blueoceanweb.co.uk/portfolio/
 If you found the Power BI Custom connector post useful please leave me a comment! 🙂
- Download ONS.zip from here https://www.blueoceanweb.co.uk/wp-content/uploads/2020/06/ONS.zip
- Extract the contents (ONS.mez) to C:Users\DocumentsPower BI DesktopCustom Connectors
- Open Power BI Desktop and search for ‘ONS’ and select connect on ‘ONS Data Source Path (Beta)
- Click continue to ignore the warning message
- Select the data you’d like
- This will return all deaths registered by the ONS, split by age group, sex, and week up until the latest available week. (This is all from the weekly-deaths-age-sex dataset).
- If you’d like to automate the load you’ll need to install the on-premises gateway, which is out of the scope of this blog, but there are lots of articles on it. The gateway is available here: https://powerbi.microsoft.com/en-us/gateway/
Each dataset has several dimensions and allowed options, think of them as filters and filter values (i.e. time = 2020 and sex = male).
For each request all dimensions must be used with valid options. There is a wildcard option however this is only allowed to be used on one dimension per request.
This means you cannot send one request to get all the data from a dataset. However, you can send many requests to get around this and we’ll get to that in a bit.
My connector uses the weekly-deaths-age-sex dataset.
To get a list of all required dimensions run this command in postman:
https://api.beta.ons.gov.uk/v1/datasets/weekly-deaths-age-sex/editions/covid-19/versions/4/dimensions
For each dimension run this command to get a list of valid options:
https://api.beta.ons.gov.uk/v1/datasets/weekly-deaths-age-sex/editions/covid-19/versions/4/dimensions/agegroups/options
I’m using the following options:
- time
- 2020 (that’s the only valid option at present)
- week (week-1, week-2, week-3 etc)
- All weeks up to the present week.
- geography
- Here I use the wild card * (to get all values)
- deaths
- I just use total-registered-deaths
- agegroups
- All values (i.e. 1-4, 10-14, 15-19…)
- sex
- male and female
- PowerBI Desktop
- Visual Studio 2019
- Power Query SDK
- My code from GitHub https://github.com/mrsheraton/ONSPowerBIConnector
Extract the content then double click the solution file (ONS.sln) to load visual studio.
Open ONS.pq and note the ONS.Contents() function. This is what will be called by PowerBI
When you run the program you’ll get this screen, set the Credential Type to anonymous and click ‘Set Credential’ and close the message box. Now rerun the program and it should display the query result where name is weekly-deaths-age-sex
At this point the connector has been built, you’ll get a complied .mez file in your debug folder.
ONSbinDebugONS.mez you can copy the steps above from 2 to get this working in Power BI Destop.
You’ll be able to create some visultions. Here is one I built (this also uses histroic data available in spreadsheets). It updates weekly on my website: https://www.blueoceanweb.co.uk/portfolio/
If you found the Power BI Custom connector post useful please leave me a comment! 🙂